Hardware & signals
Thermodynamics Lab
Three sensors, a 40W heater, and a dashboard that proves the first law of thermodynamics in real time.
SAMPLE RATE
6s
BAUD
9600
HEATER
40W
The problem
You are told in a lecture that energy is conserved. You write W = Q + Q_loss in an
exam and you get the mark. At no point does anyone hand you an instrument and let
you watch it be true.
I wanted the rig that closes that gap: measure the electrical energy going into a heater, measure the heat arriving in the water, and see whether the books balance — live, on a screen, with the losses visible as the gap between the two.
What I built
An Arduino reading three sensors, a Python dashboard reading the Arduino, and a verdict printed after every run.
Every six seconds the Arduino samples water temperature, heater current and supply voltage, computes instantaneous power and accumulated energy, and pushes one CSV line down the USB serial link at 9600 baud. The dashboard plots temperature as it climbs and, when you press stop, computes the balance:
| Symbol | Formula | Meaning |
|---|---|---|
| W | ∫P dt | electrical energy supplied |
| Q | m·c·ΔT | heat absorbed by the water |
| Loss | W − Q | energy lost to the room |
| η | Q/W × 100% | thermal conversion efficiency |
Then it prints a colour-coded verdict confirming that W = Q + Q_loss.
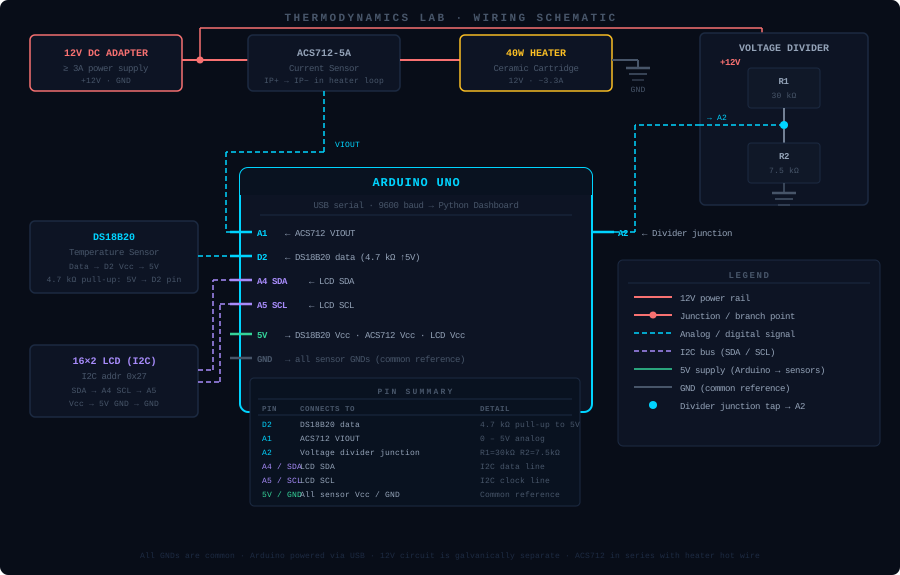
The whole rig. DS18B20 on D2 with a 4.7kΩ pull-up, ACS712 in series with the heater hot wire, a 30k/7.5k divider scaling the 12V rail into A2.
How it works
The current sensor sits in series with the heater's hot wire, so it measures what actually reaches the element rather than what the supply claims to deliver. The voltage divider — 30kΩ over 7.5kΩ — maps the 0–25V rail into the Arduino's 0–5V window, with the ×5 factor applied in firmware.
The DS18B20 is a one-wire digital sensor, which matters: an analogue thermistor would have needed calibration against a reference and would have drifted through the run, and a drifting ΔT is a lie about Q that looks exactly like a real result.
A 16×2 I2C LCD on the board cycles through temperature, voltage-and-current, and accumulated energy, so the rig is legible without a laptop attached.
The dashboard ships as a real download. GitHub Actions builds a Windows .exe and a
macOS .app on every release tag, so a classmate can run the experiment without
installing Python.
Decisions
Compute energy on the Arduino, send accumulated totals
Streaming raw samples and integrating on the PC
If the serial link drops a line — and over a long run it will — an integrator on the PC silently under-reports the total, and the error looks like a real efficiency loss. Accumulating on the microcontroller means a dropped line costs you one plot point, not the answer.
DS18B20 one-wire digital sensor
An analogue thermistor into an ADC
ΔT is the entire heat measurement. A thermistor needs calibration against a reference and drifts across a run, and a drifting ΔT produces a plausible-looking wrong answer — the worst failure mode an instrument can have.
Shipping signed-free .exe and .app builds via GitHub Actions
A README that says pip install -r requirements.txt
The audience is classmates with a lab report due, not Python developers. An experiment nobody can run is a repo, not an instrument — and the Gatekeeper workaround in the README is a smaller ask than a toolchain.
What I'd do differently
The specific heat capacity of water is hardcoded, and the water mass is typed in by the operator. Both are fine for a demonstration and both are exactly where a real error would hide — a mistyped mass produces a confident, wrong η that the verdict line will happily confirm. A plausibility check on the resulting efficiency would catch it in one line.
I'd also log the raw stream to a CSV alongside the plot. Right now the run exists only while the window is open, which means you can prove the first law and then have nothing to put in the report.